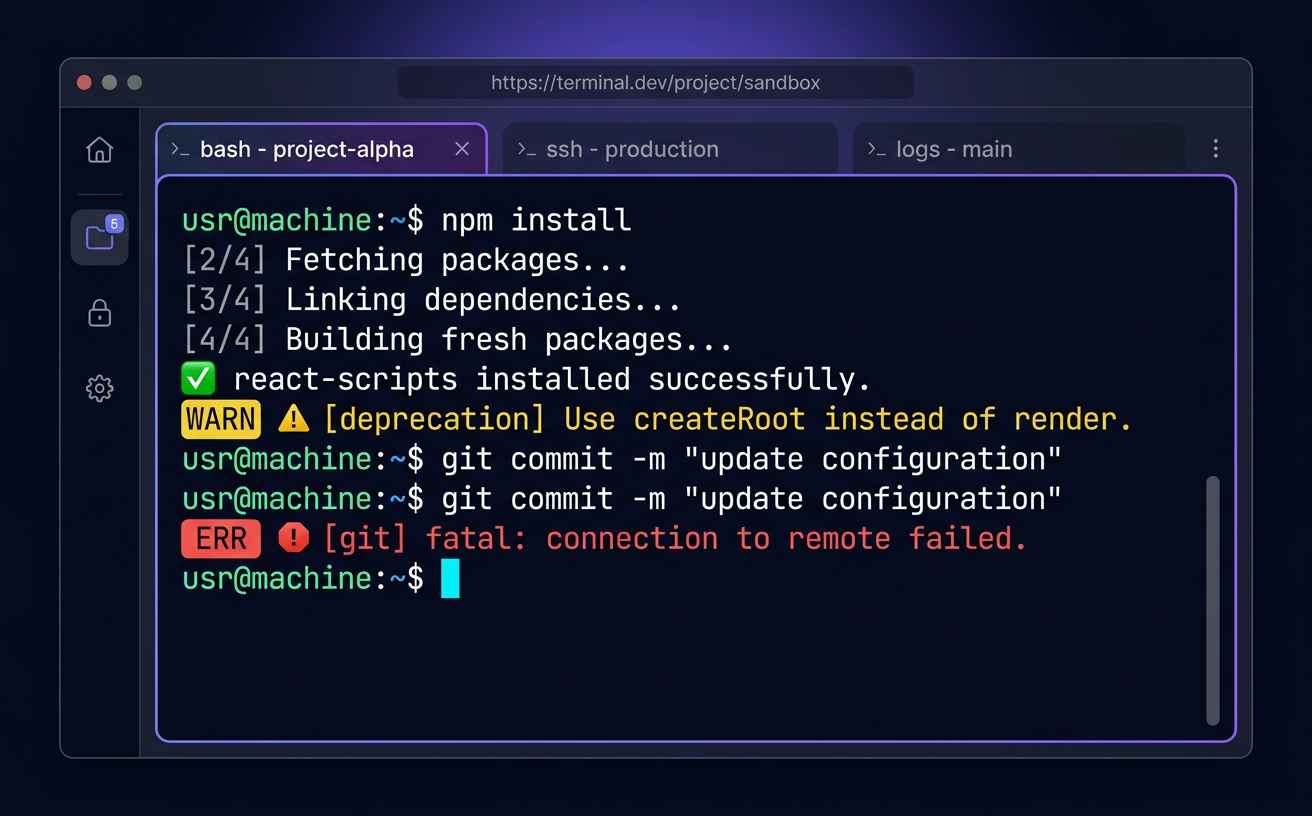
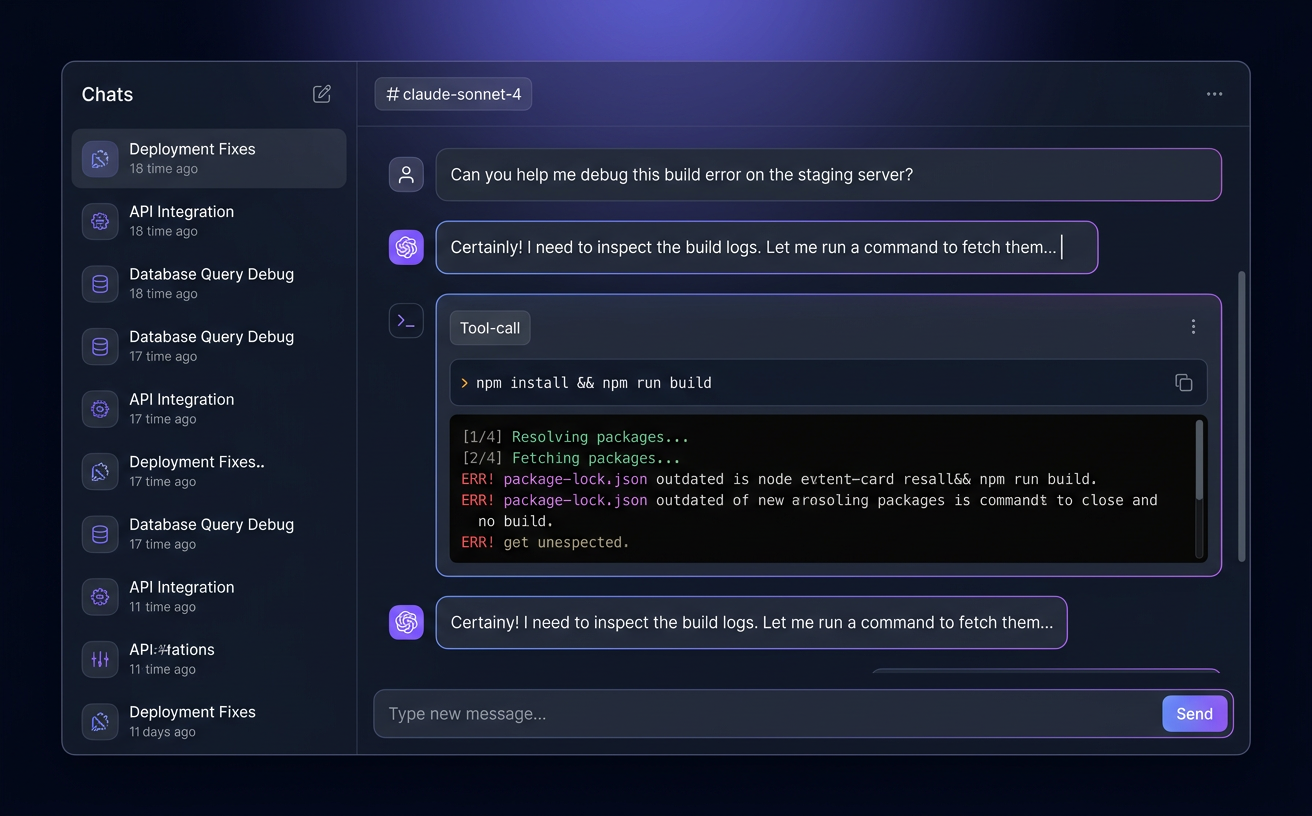
Not everyone thinks in monospace.
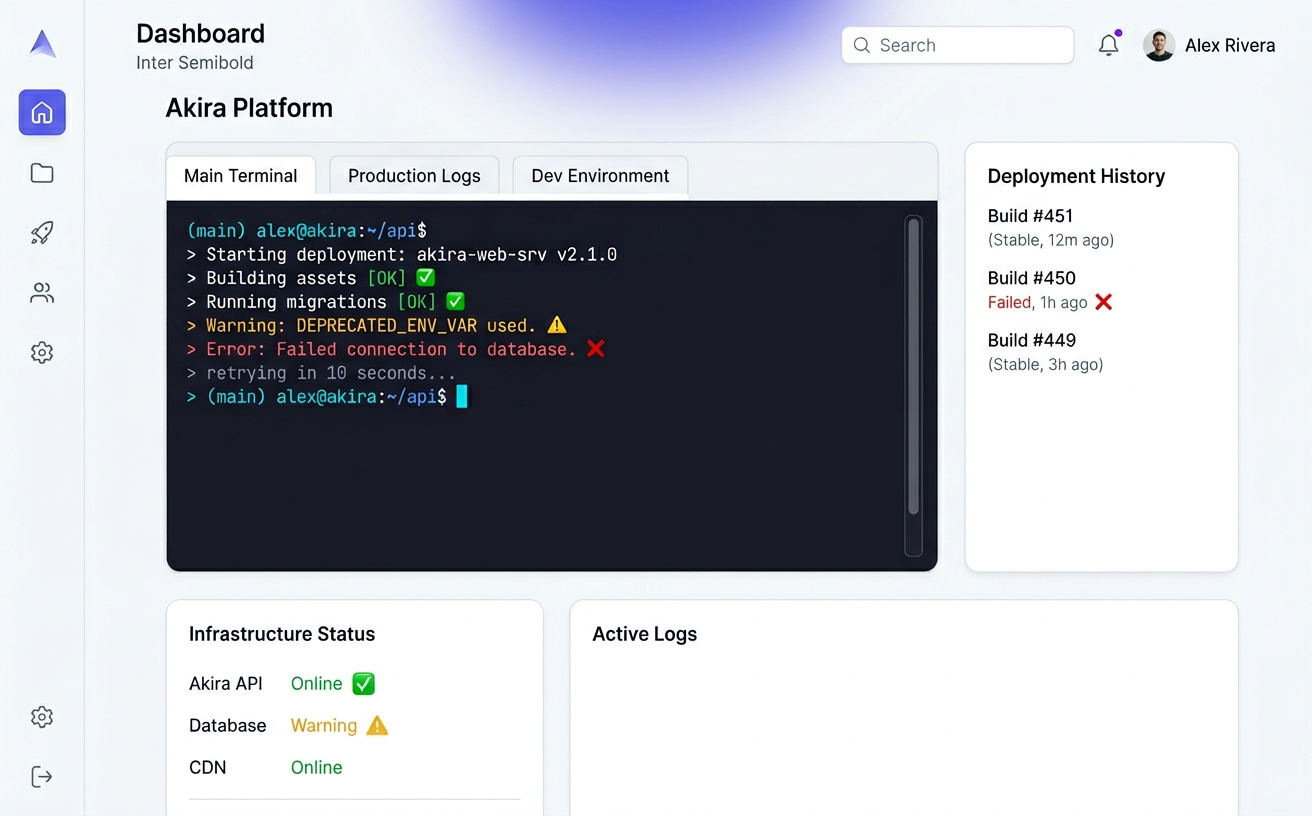
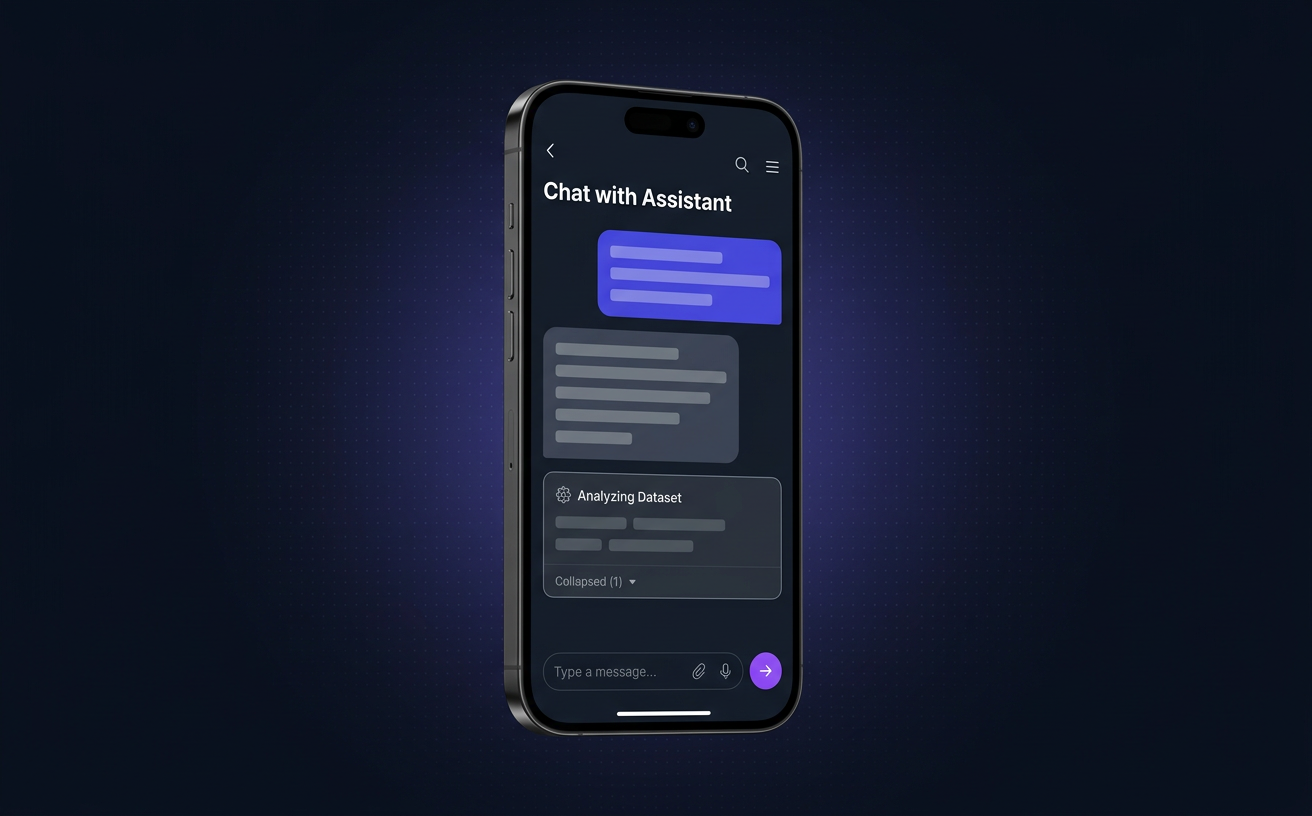
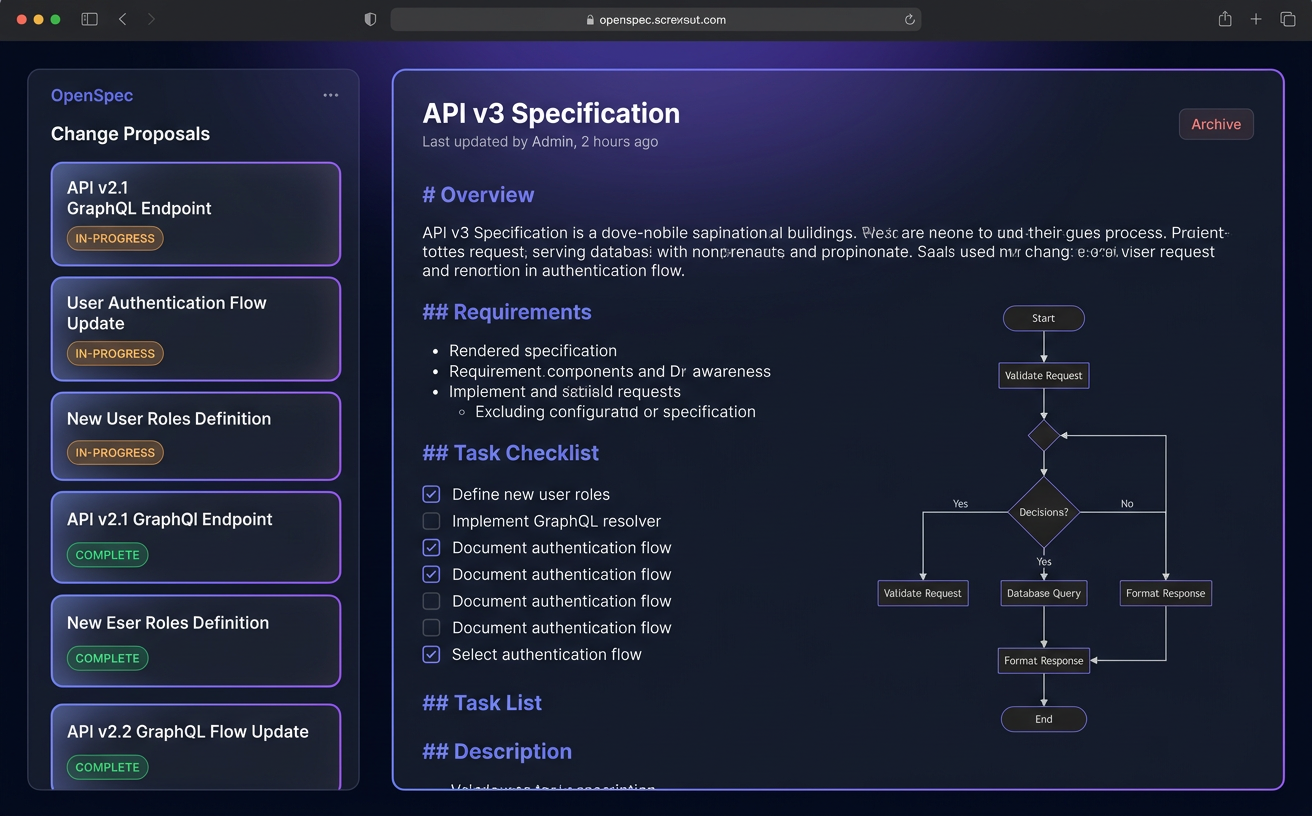
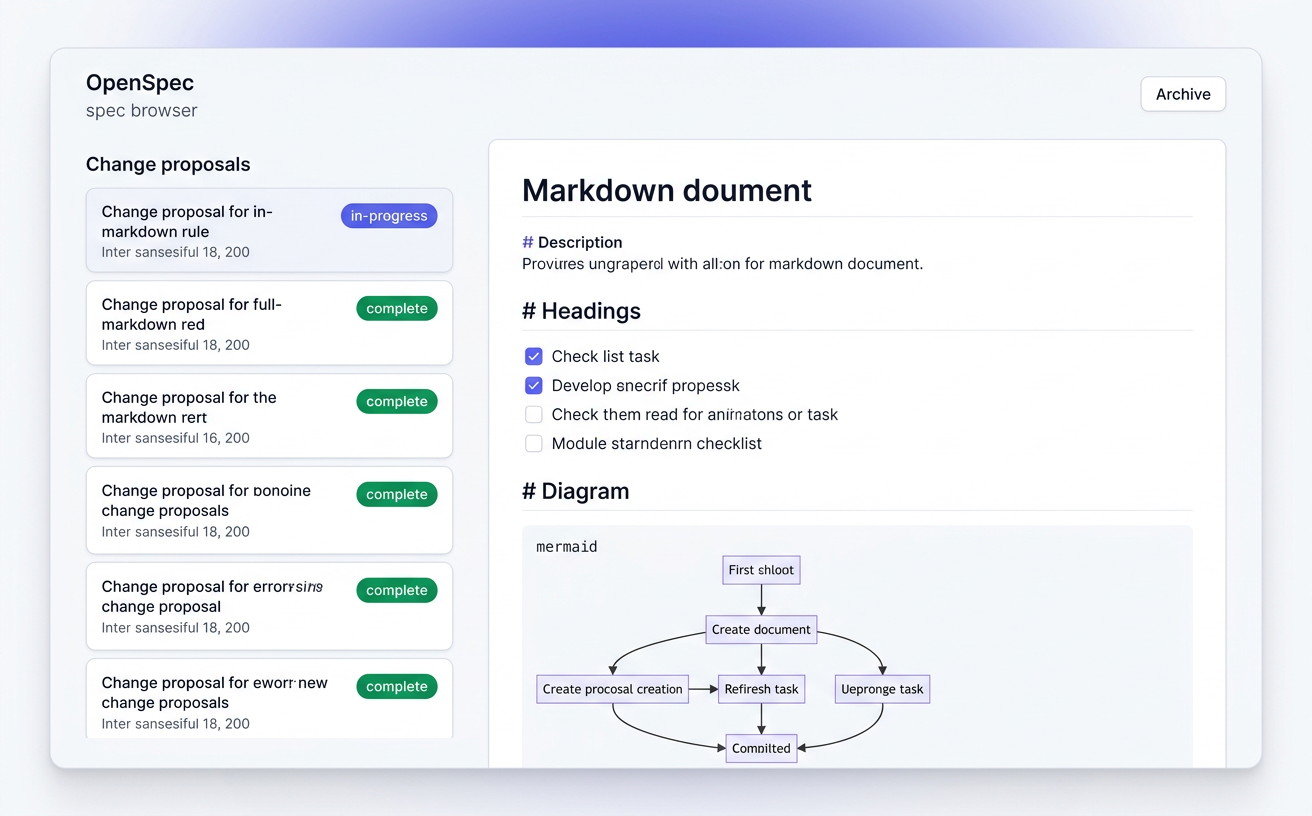
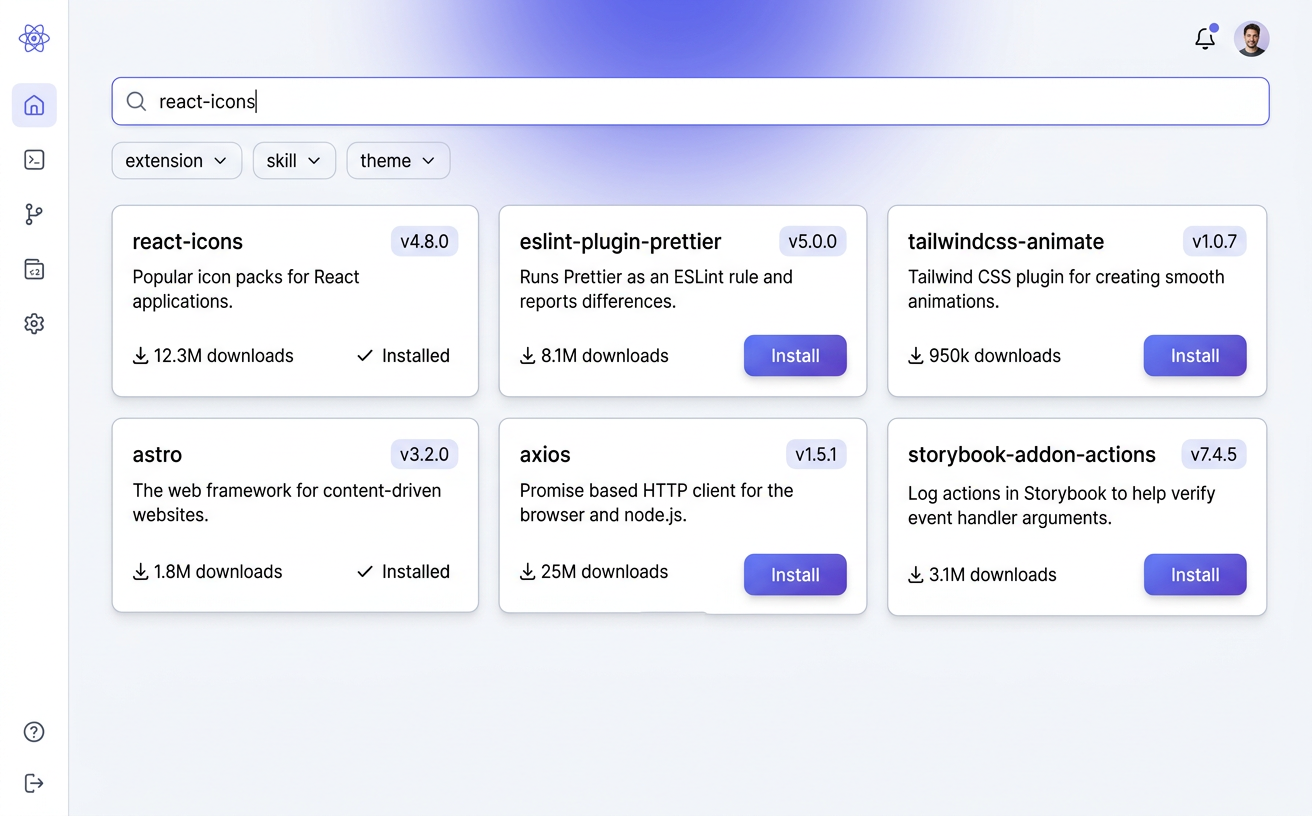
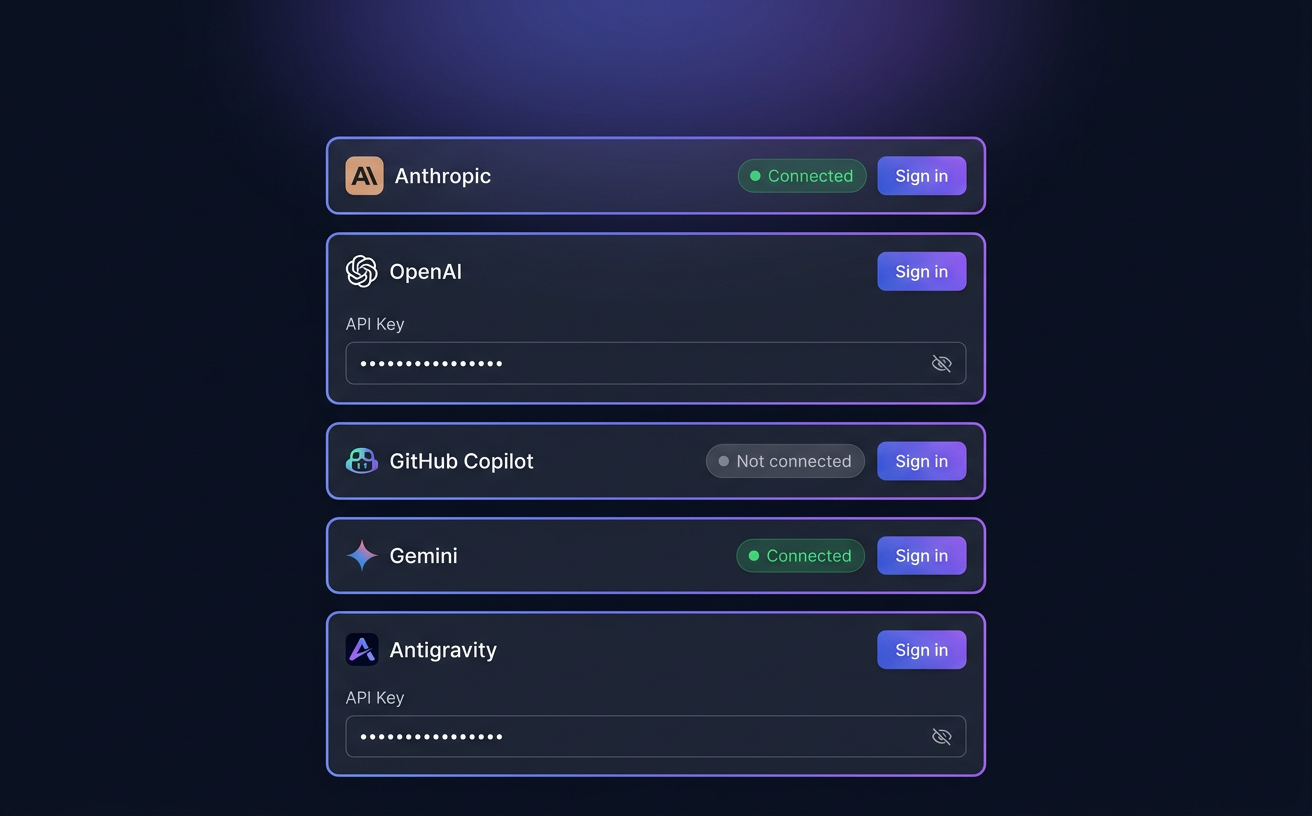
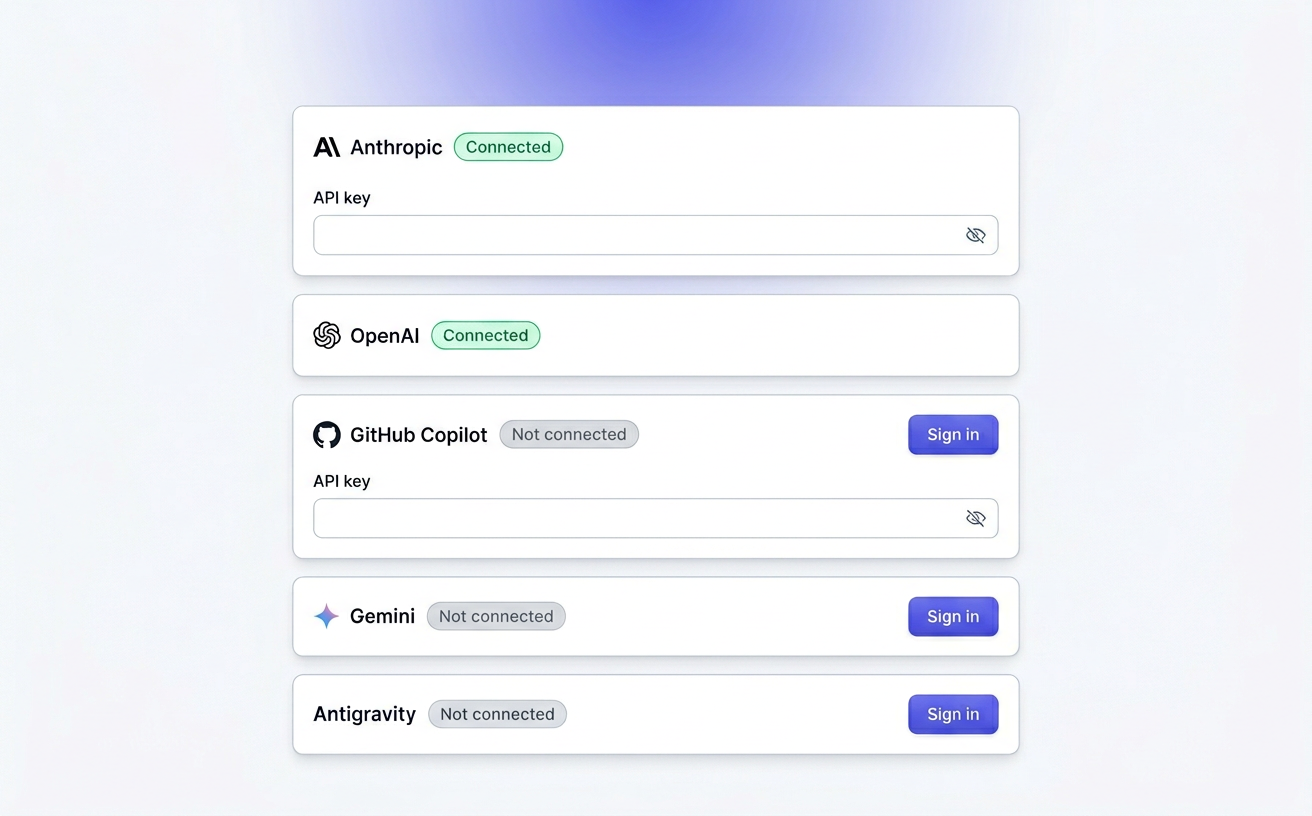
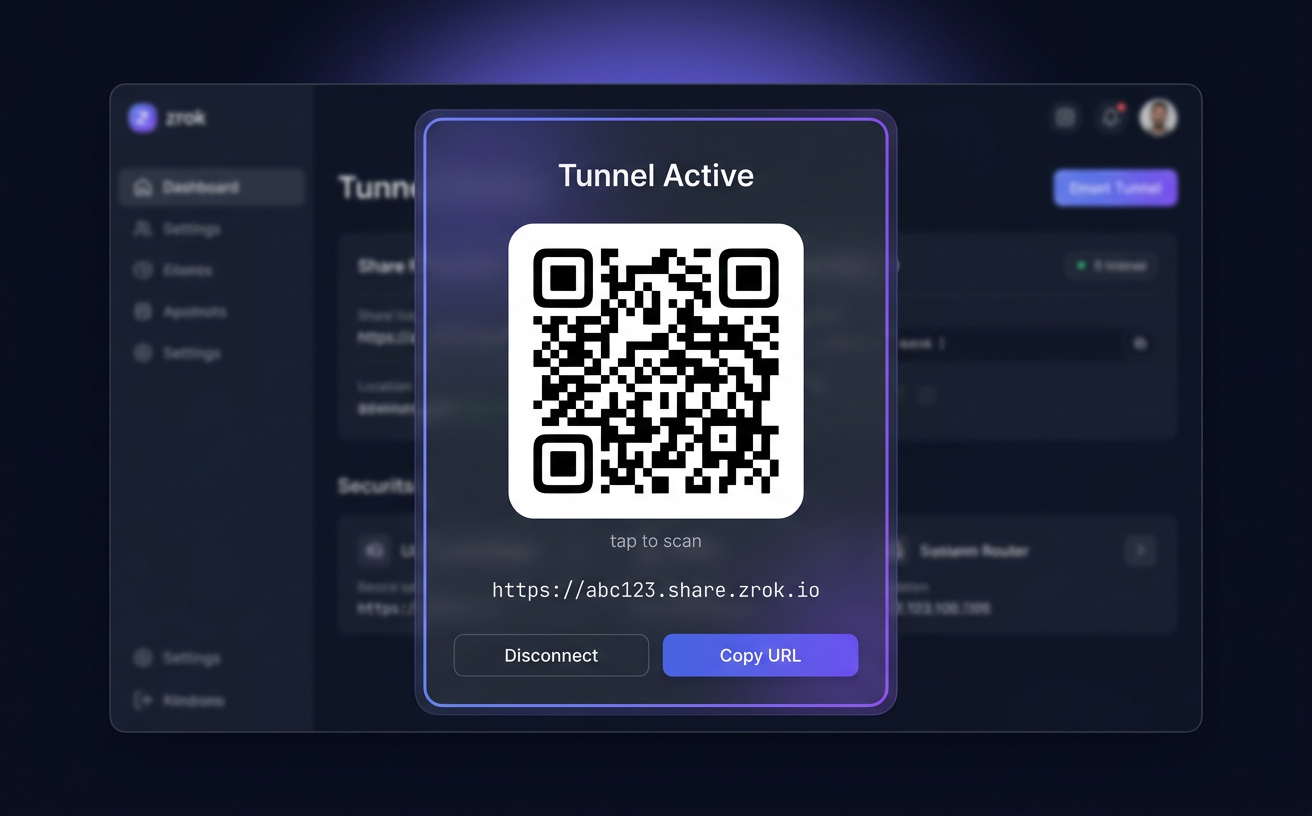
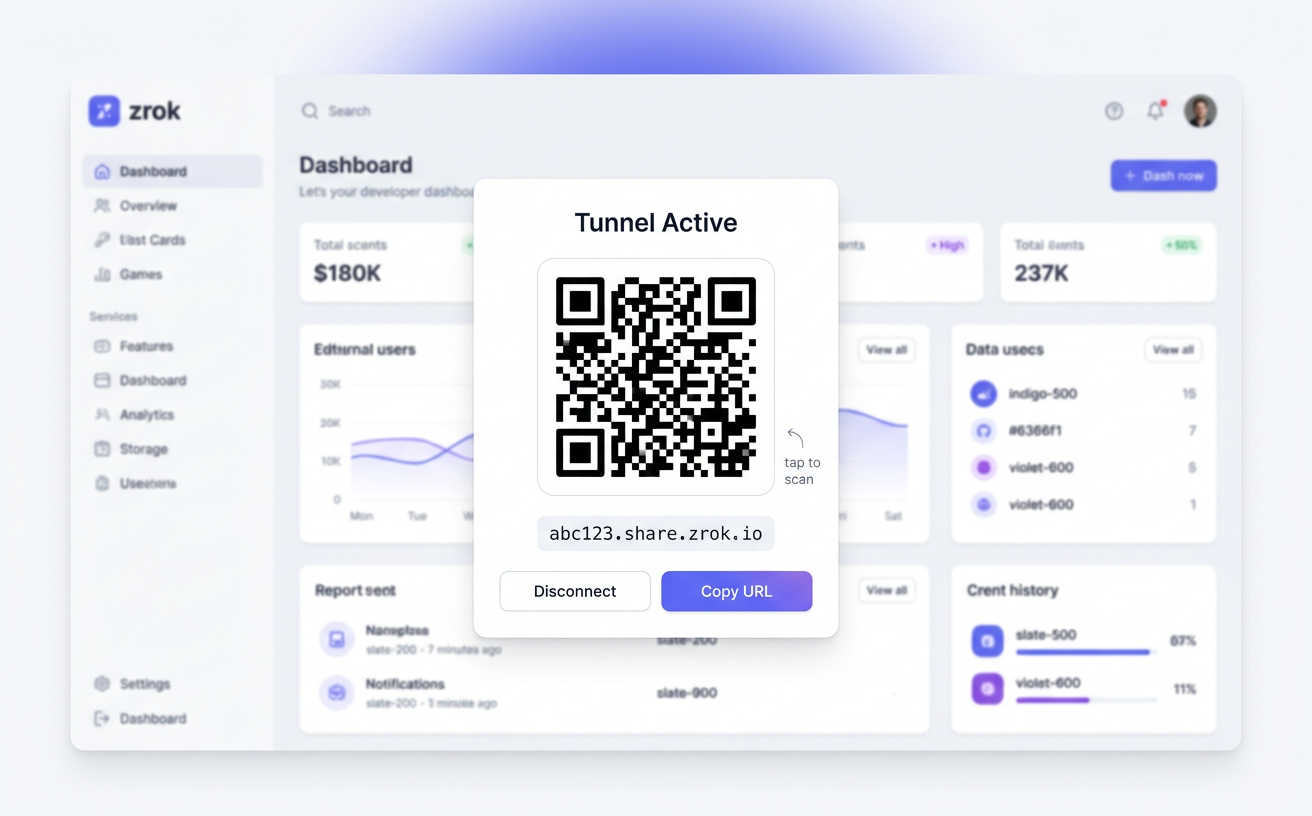
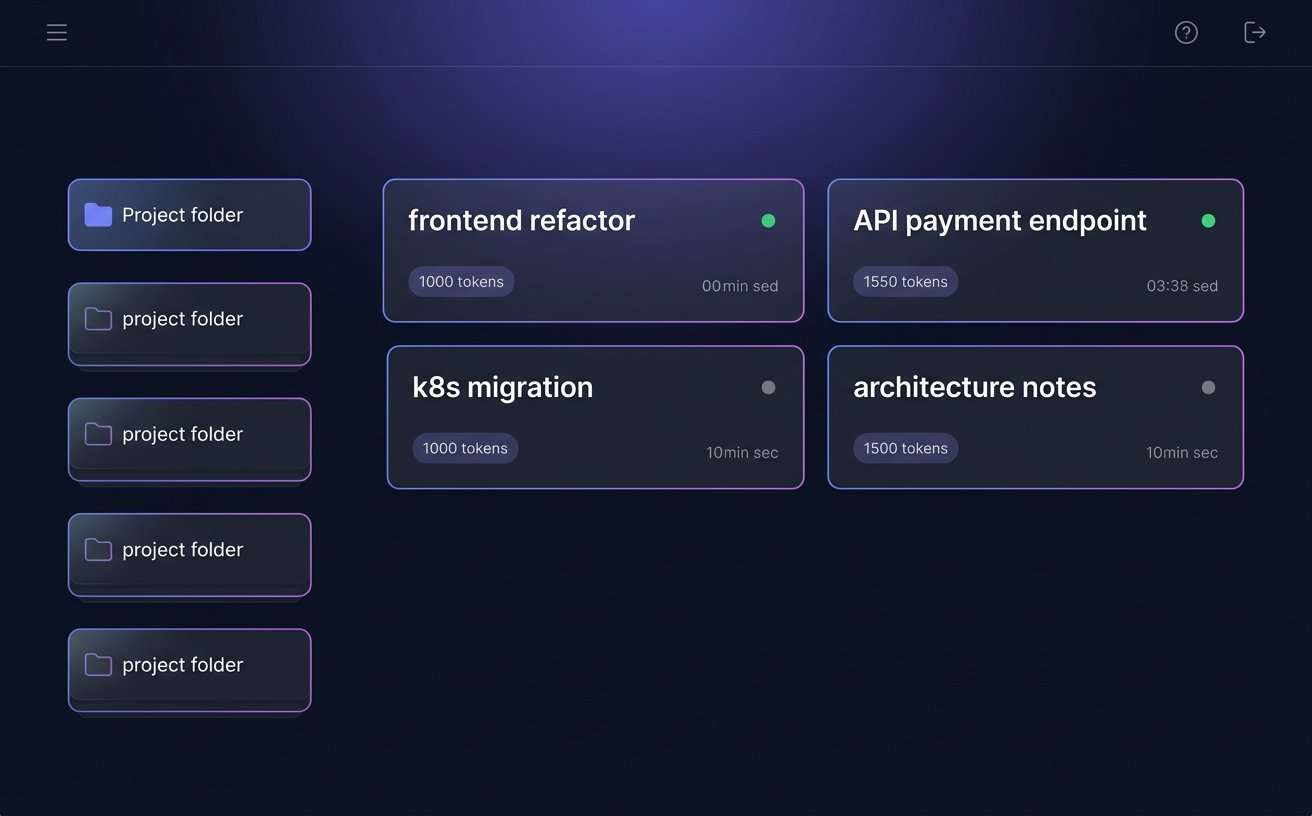
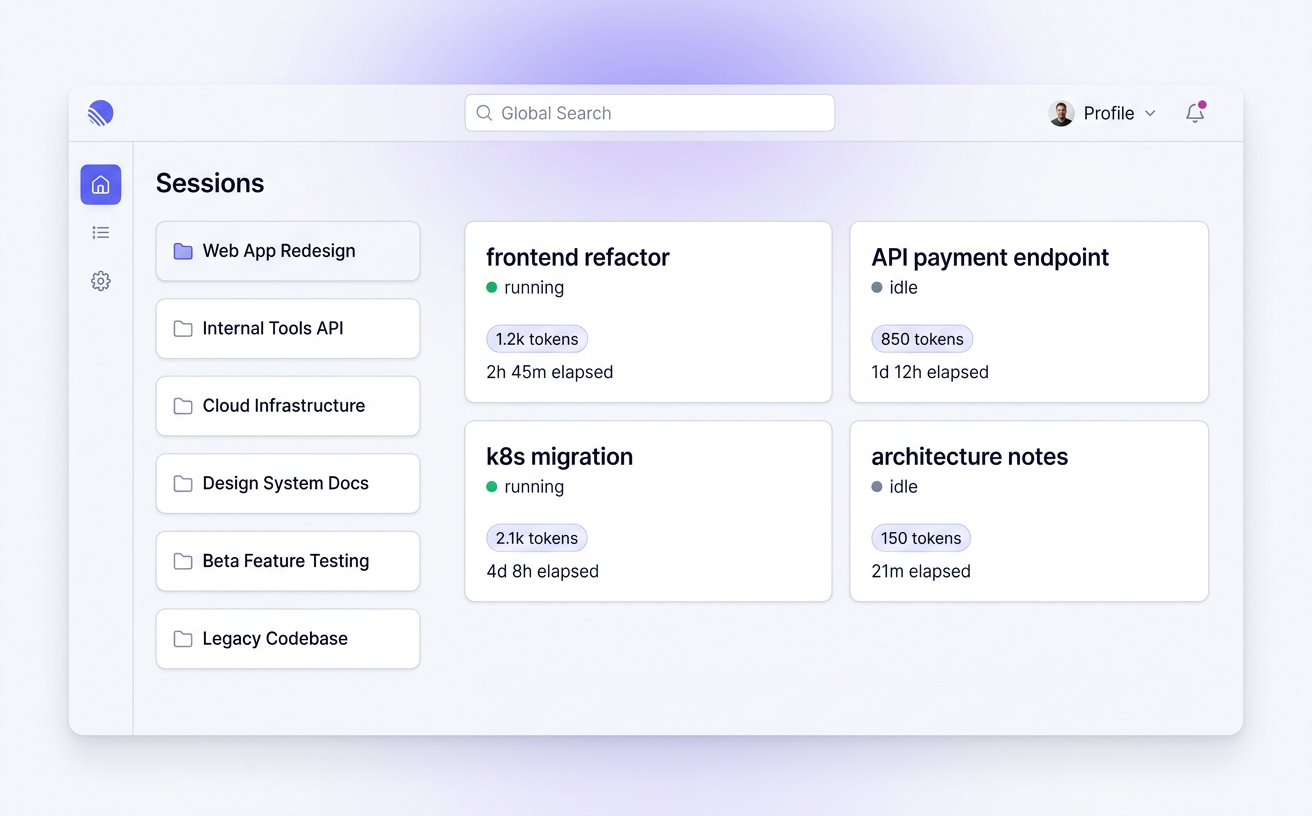
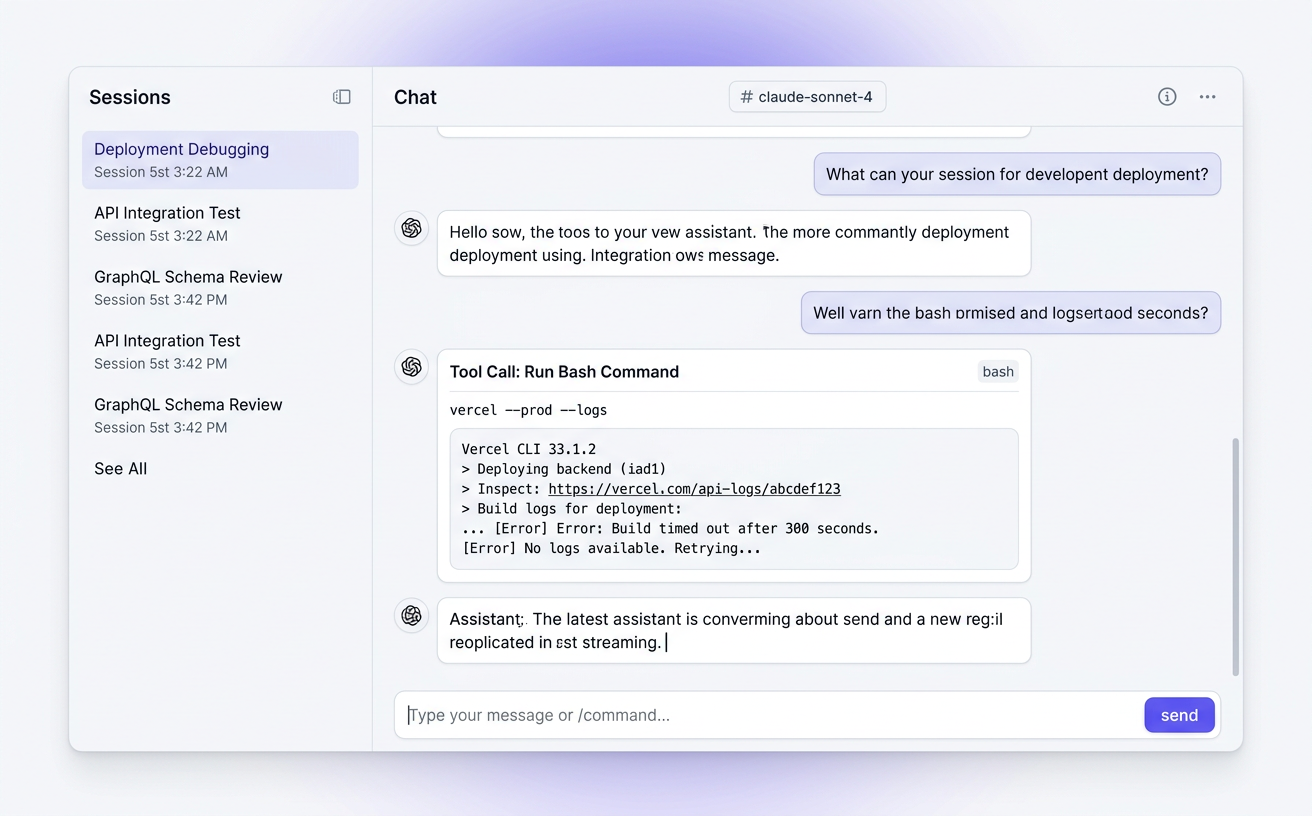
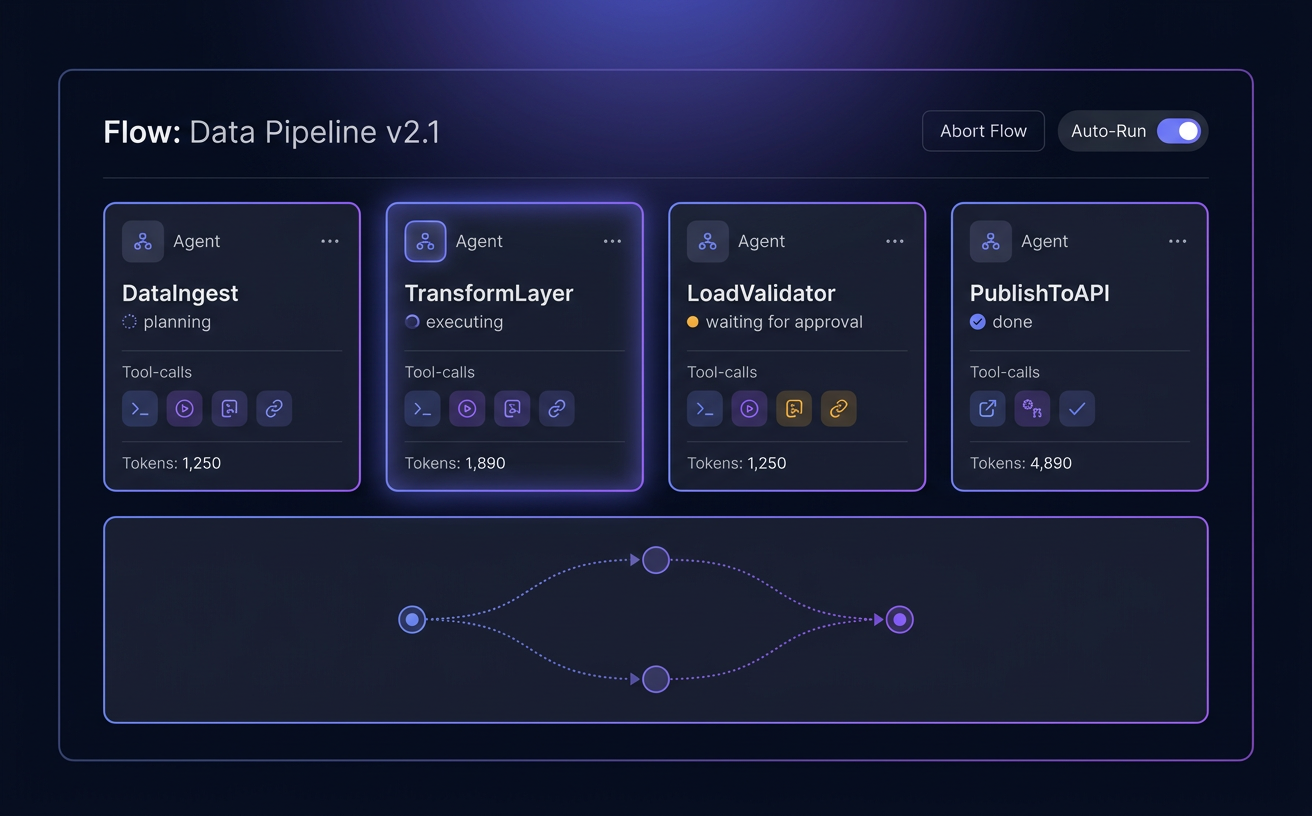
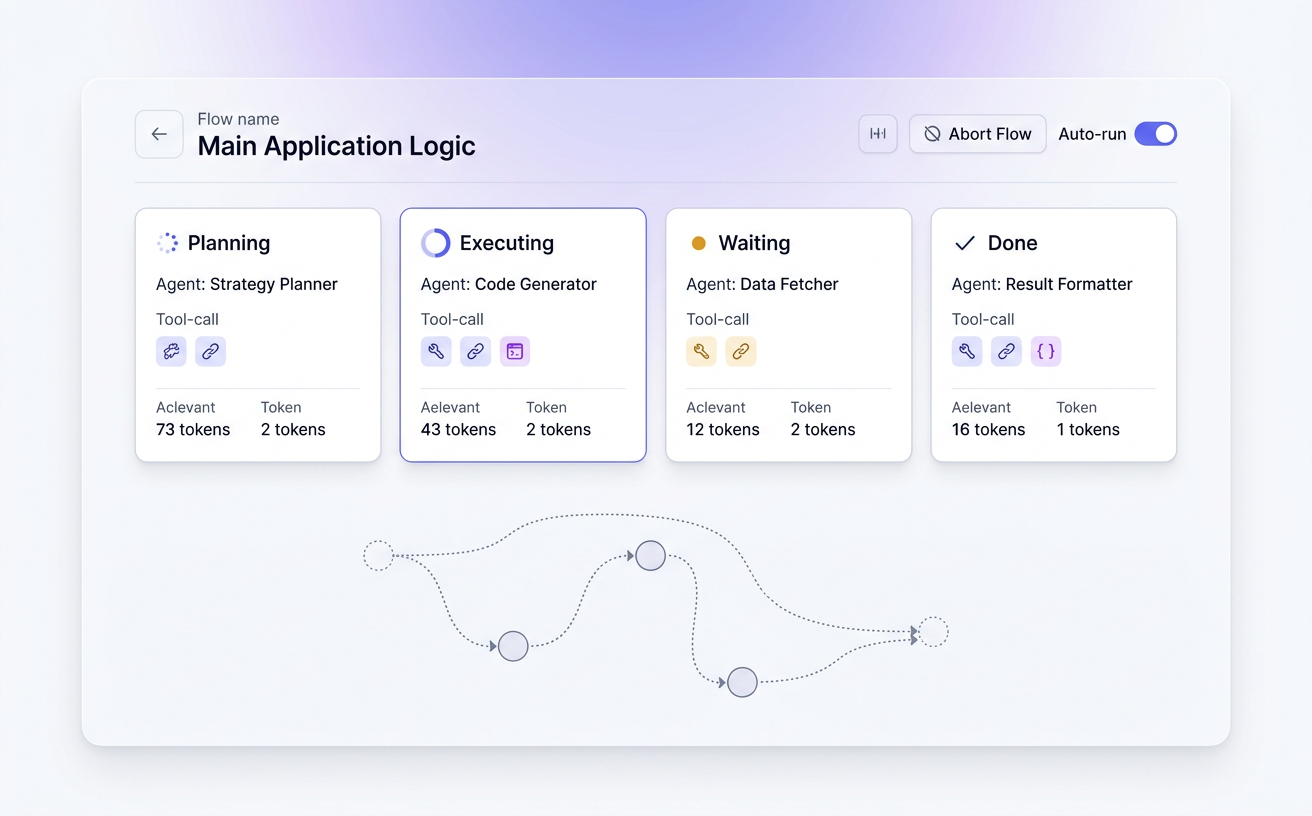
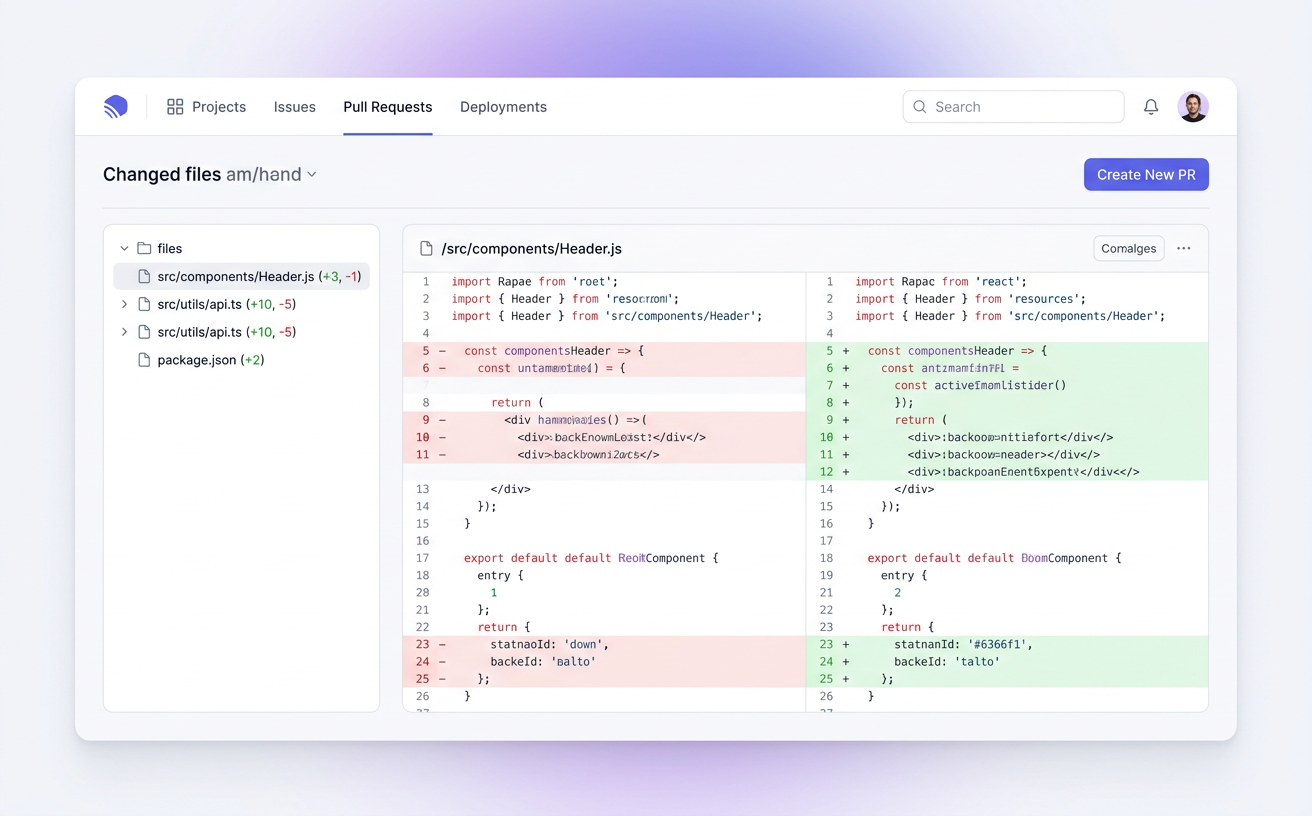
In a terminal, every message has the same weight. In a dashboard, importance has a size. Active sessions are big. Idle ones are small. Running flows glow. Errors shout.
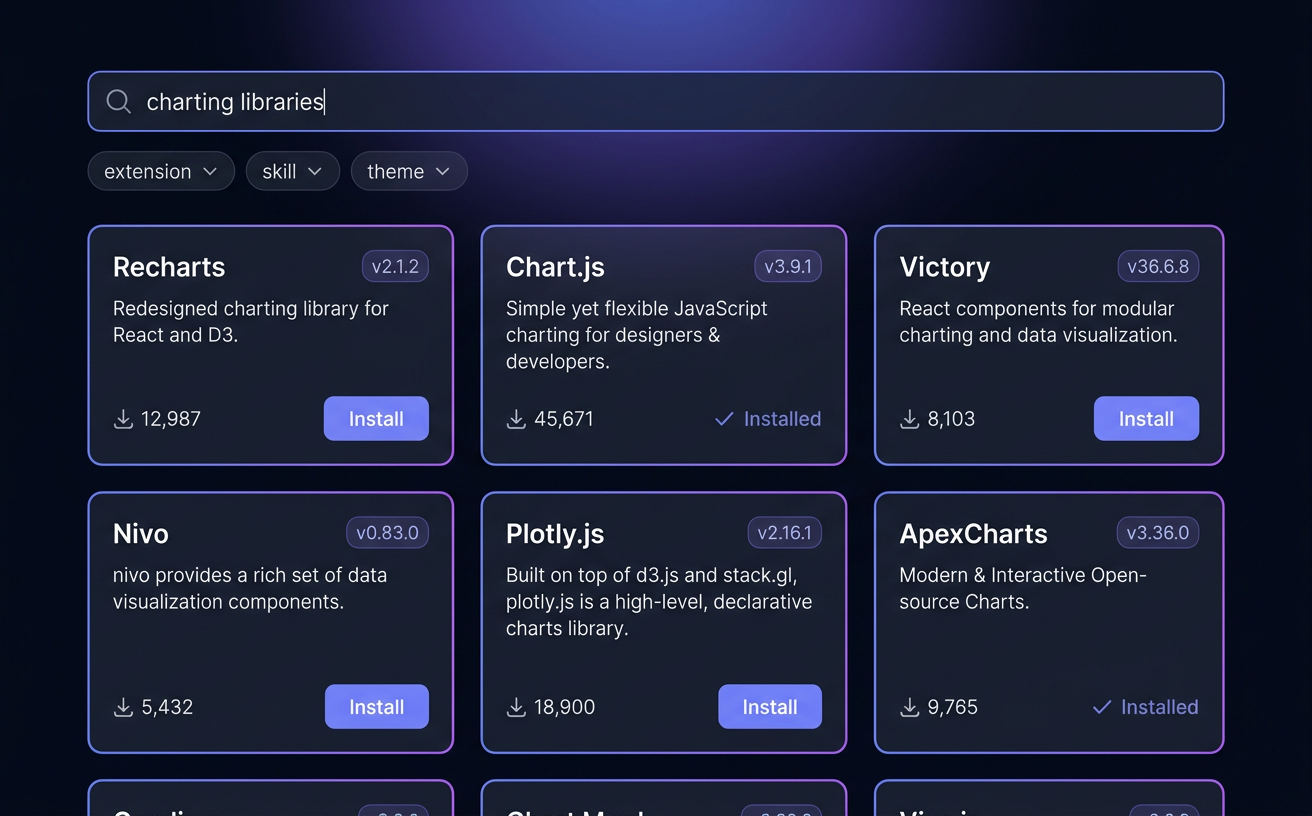
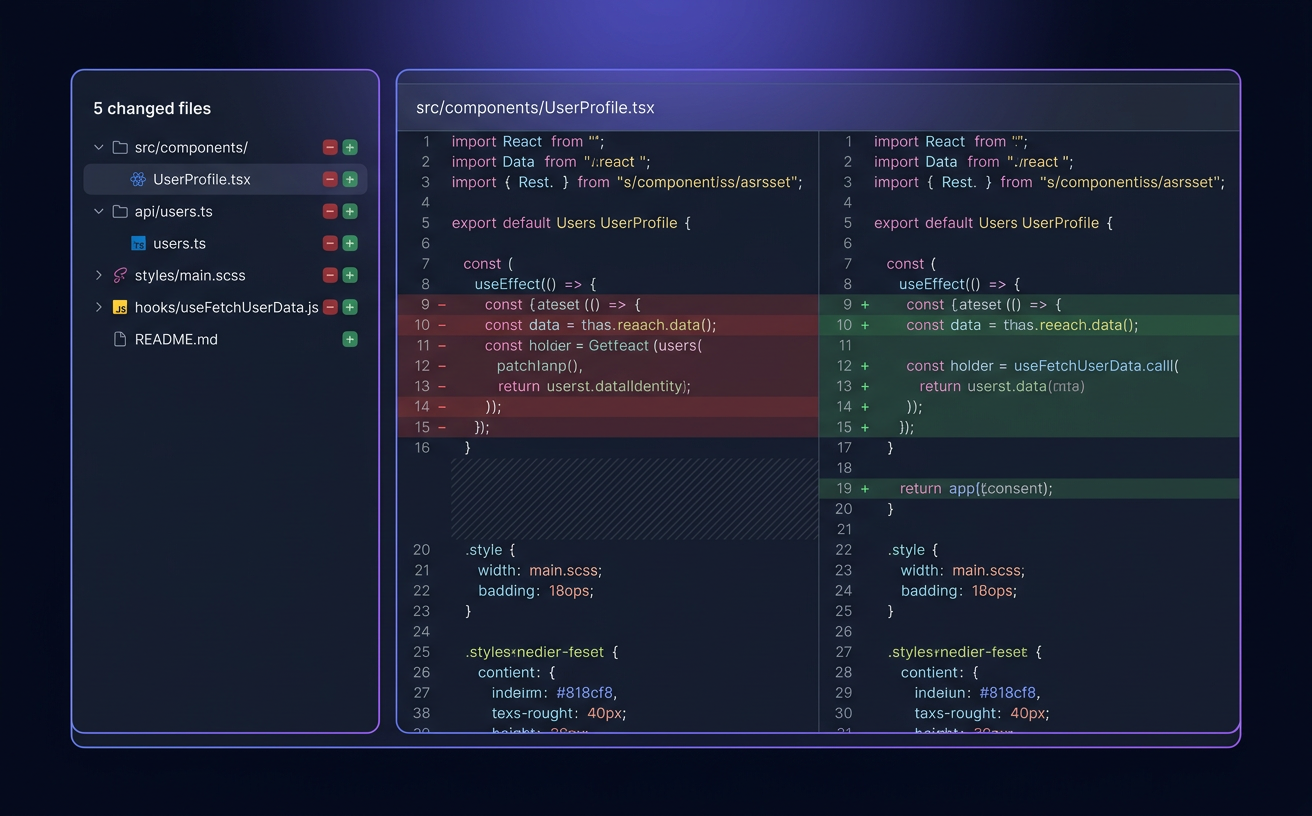
You can see many sessions at once — not just the one your cursor is in. Information density goes up. Cognitive load goes down.
> pi
──────────
assistant: …
user: …
assistant: …
user: …
assistant: …
> ▌
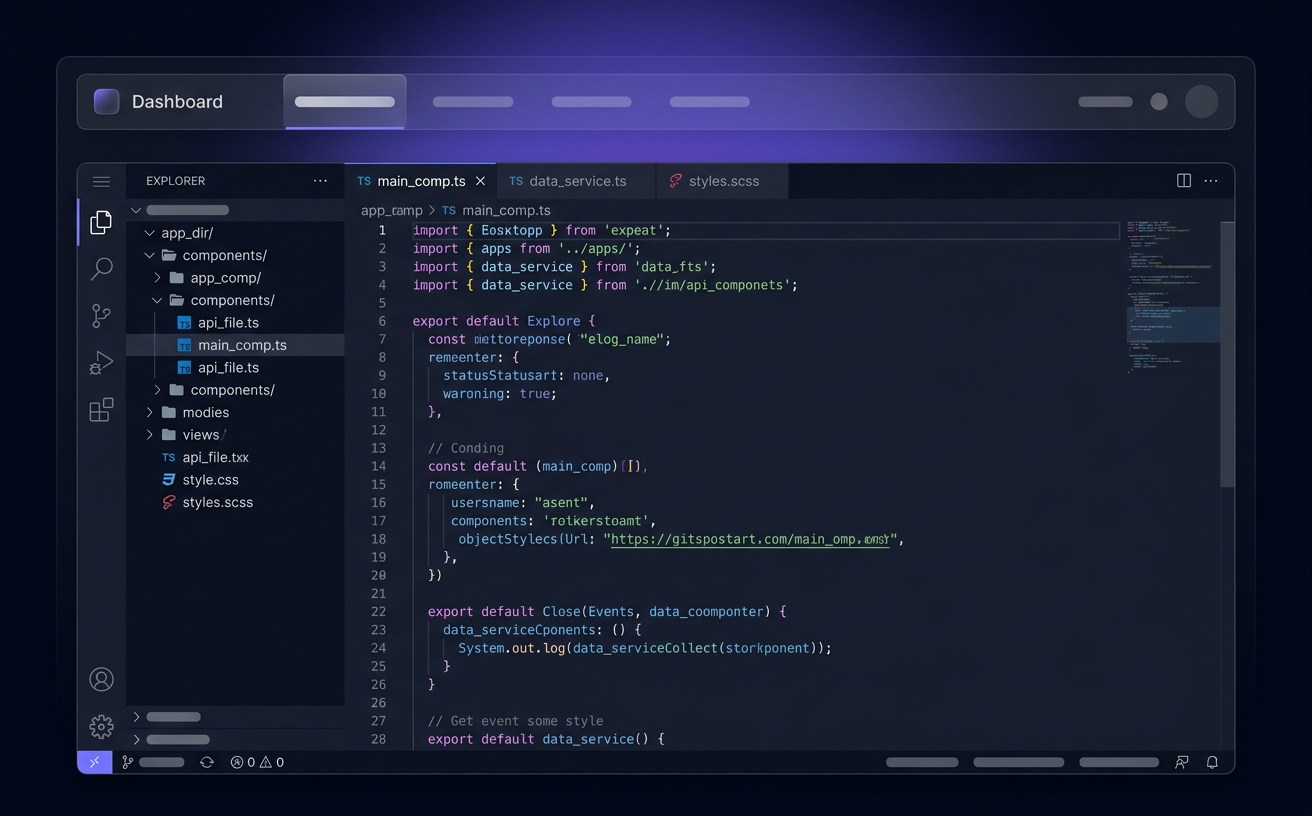
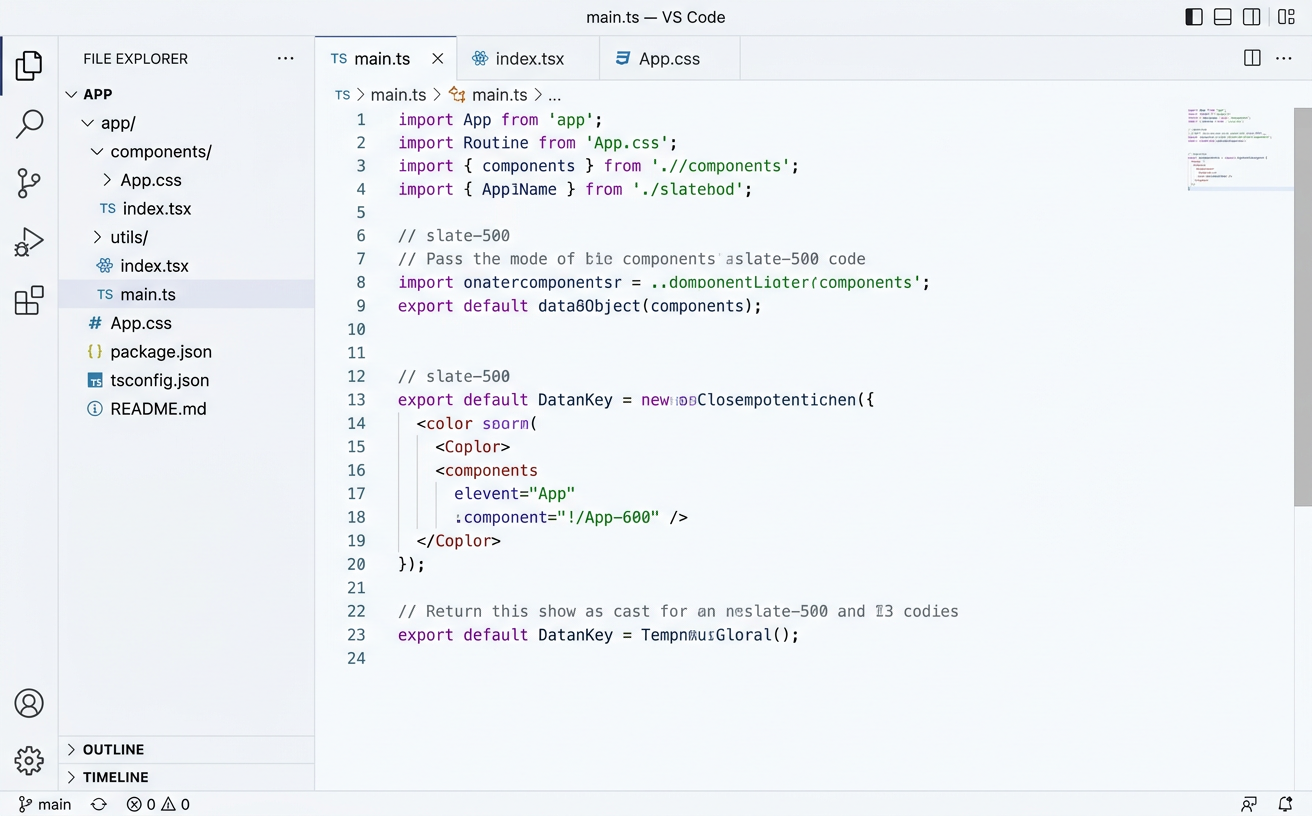
one story at a time
many stories, at a glance